Samples
A brief selection of samples of my work from Reporting Guidance for new implementations, to dashboards and complex custom reporting Post Go-Live.
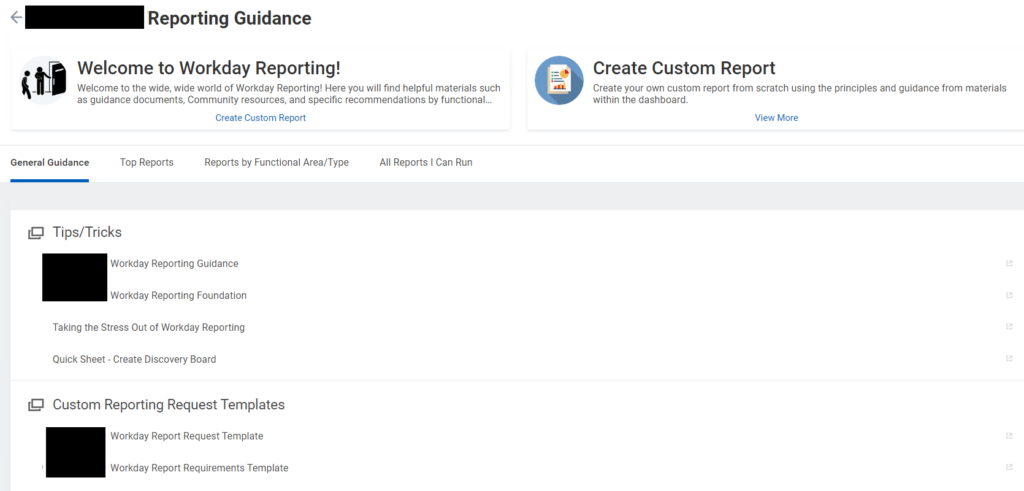
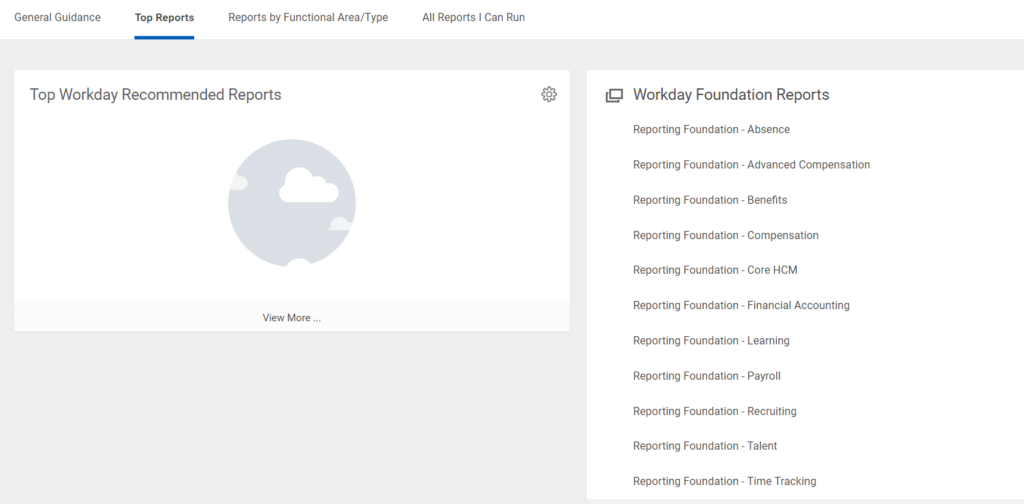
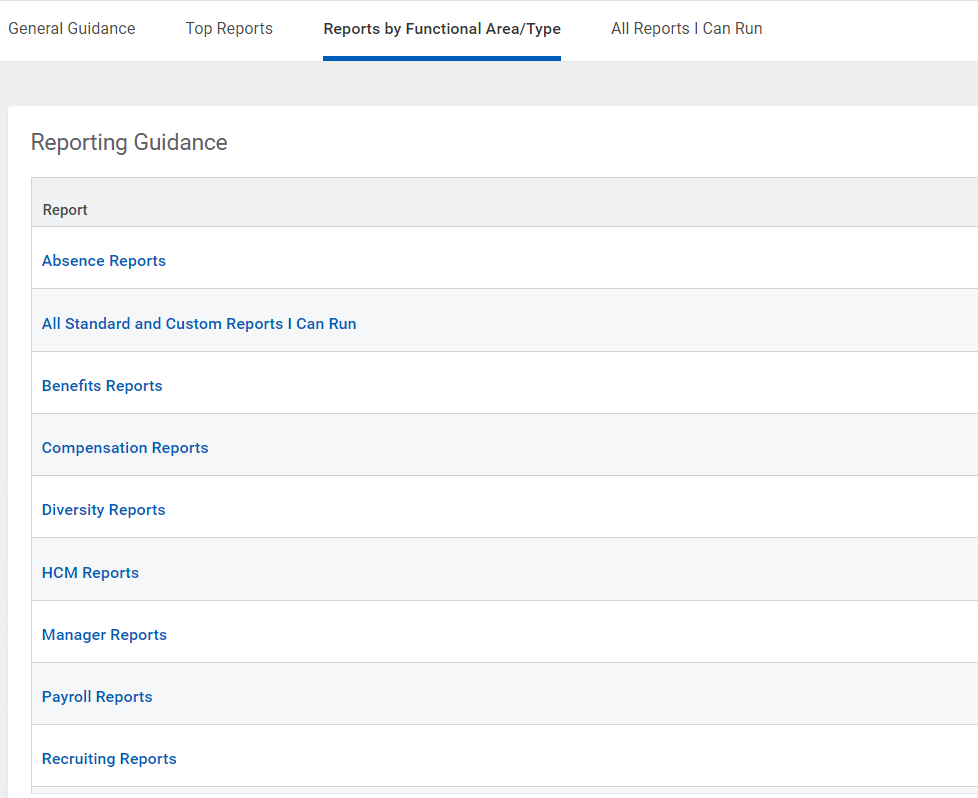
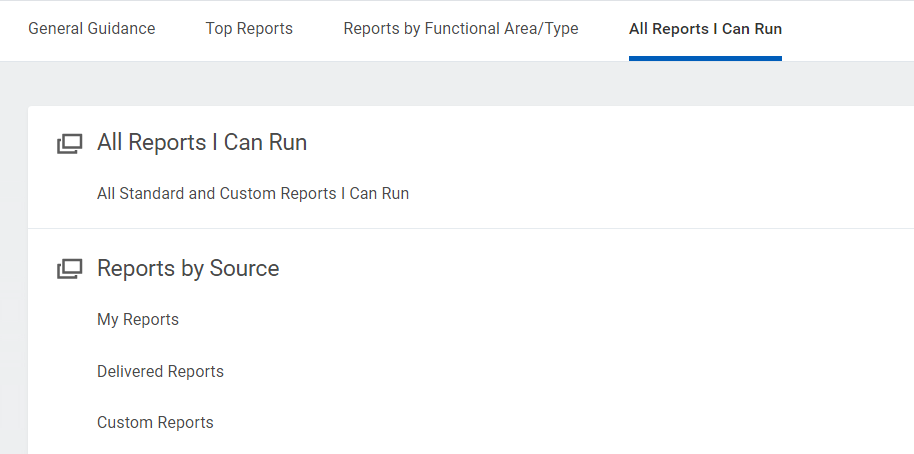
Reporting Guidance Dashboard
I created this dashboard as a way to (primarily) guide new Workday customers through the wide world of Workday reporting. It helps both newer report writers and users on customer teams to get acquainted with Workday’s top recommended delivered reports and tools.
Throughout its 4 tabs, it contains Workday official documentation, referenceable reports by functional area (meaning, you can link directly to recommended reports you have access to and run them ad-hoc as you explore), and tips for creating your own reports and discovery boards. It can also be customized to highlight your organization’s own “Top” reports through the use of report tags.
This dashboard has helped many new implementation customers (particularly on Launch projects) adopt and leverage the full capabilities of Workday’s out of the box and custom reporting capabilities as they’re getting started in the tenant.
Custom Payroll Reports
Payroll reports are probably the number one area in which I see customization. Whether it’s a 3rd party vendor requiring specific data being included in a particular format, or you’re just trying to create greater visibility into your own data for payroll managers, there’s a custom solution for that in my toolbox! Matrix and composite reporting are especially useful in custom payroll reports so you can group and visually format your reports into a structure that’s user friendly and efficient for your team to gather its data.
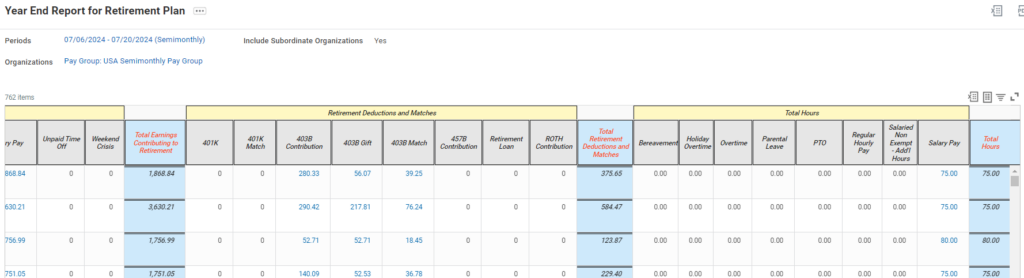
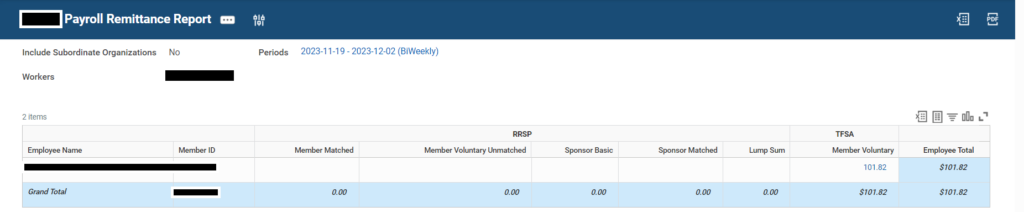
Reports can be customized to run dynamically through custom prompt sets to target individual earnings or deductions, or groups of your organization’s payroll components. The best part is Workday reports are smart enough to remove “clutter” you don’t need from the report’s output. In other words, if you prompt for “Garnishments,” a specific payroll deduction, and the prompted population of employees did not have this included within the prompted range, there will not be a column for that particular pay component.
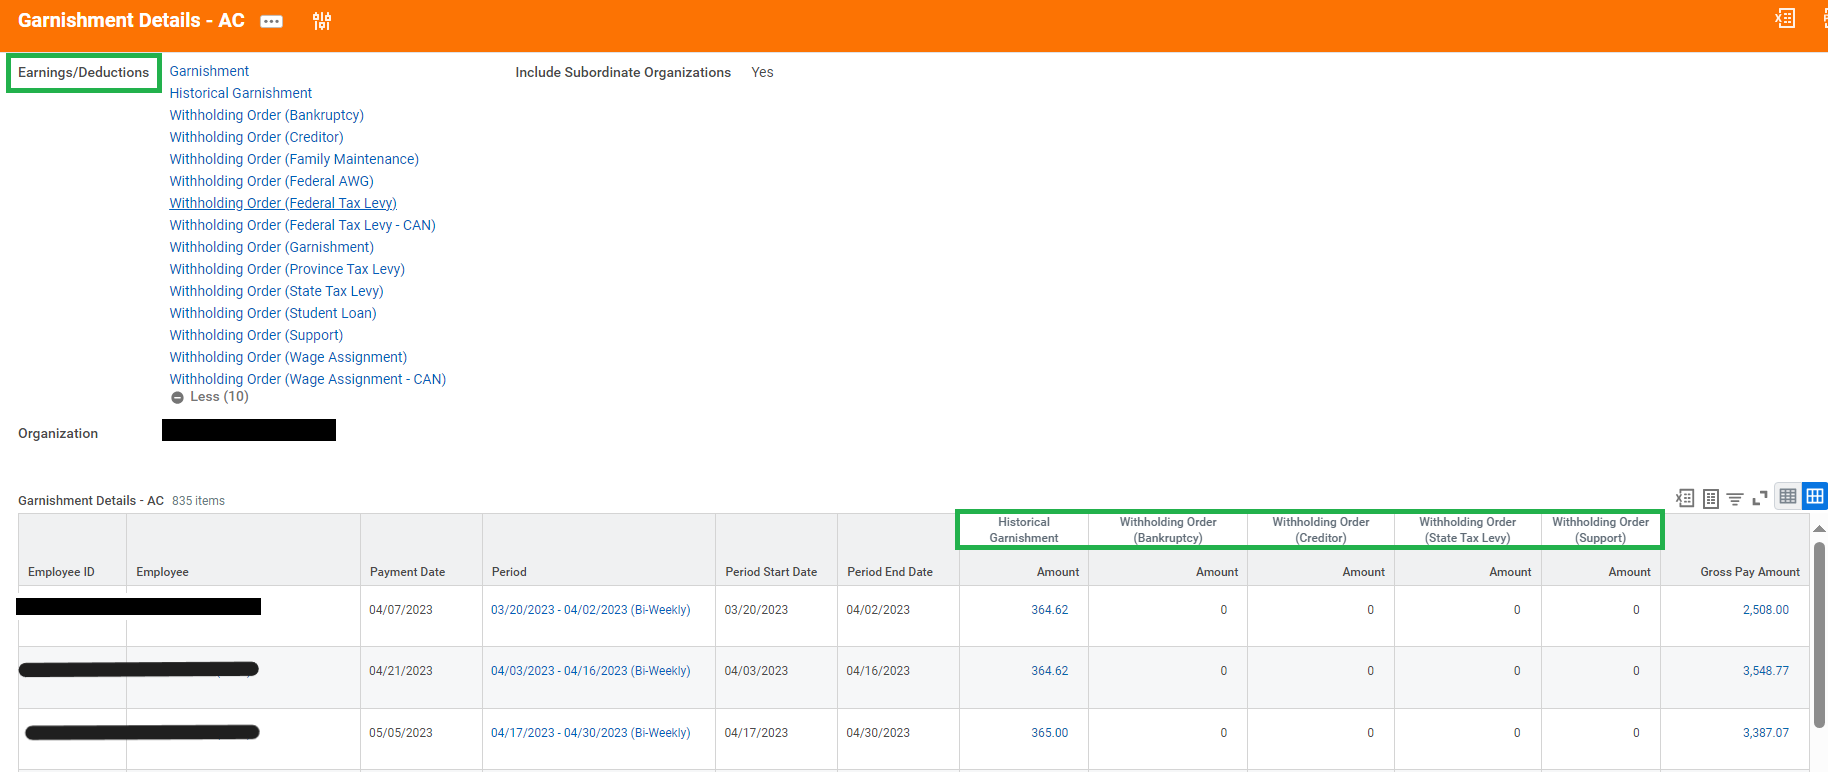
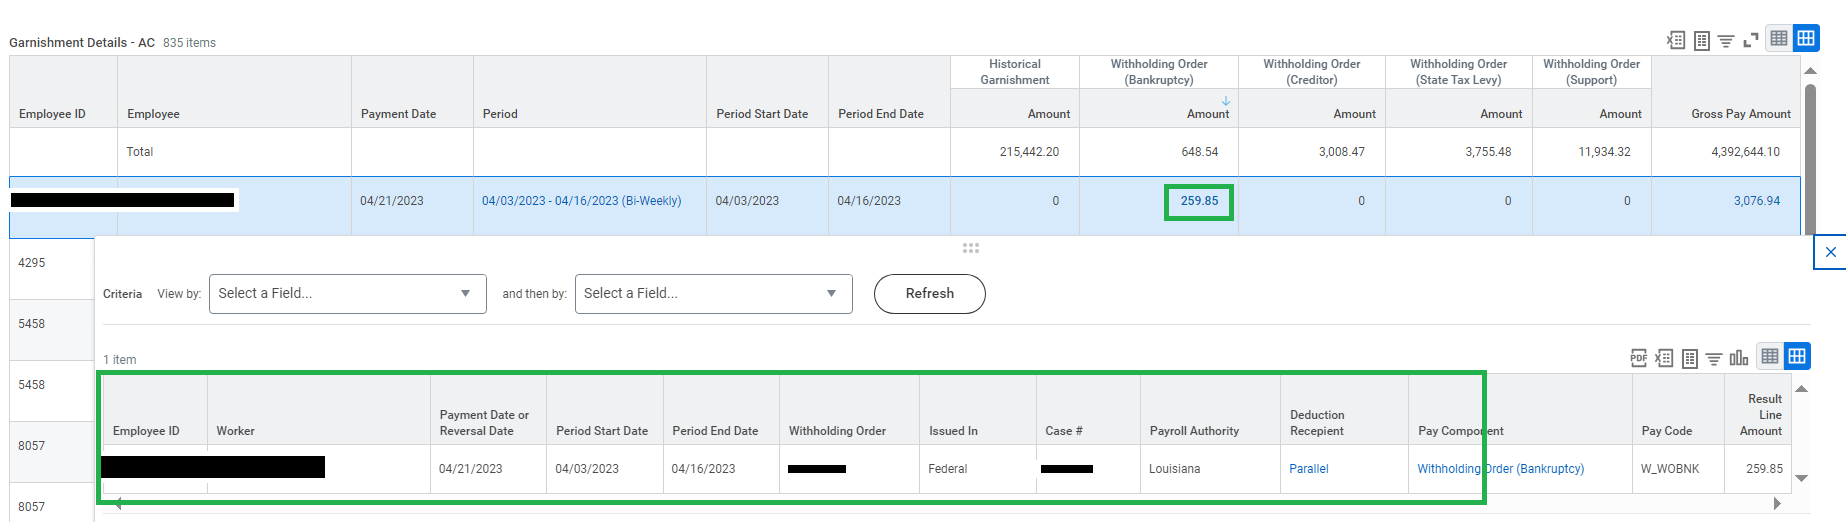
Workday reports allow you to easily drill into your organization’s data, as well. The sample below is a “drillable” table that expands the employee’s information in relation to the calculations shown in the report.
Financial Reporting
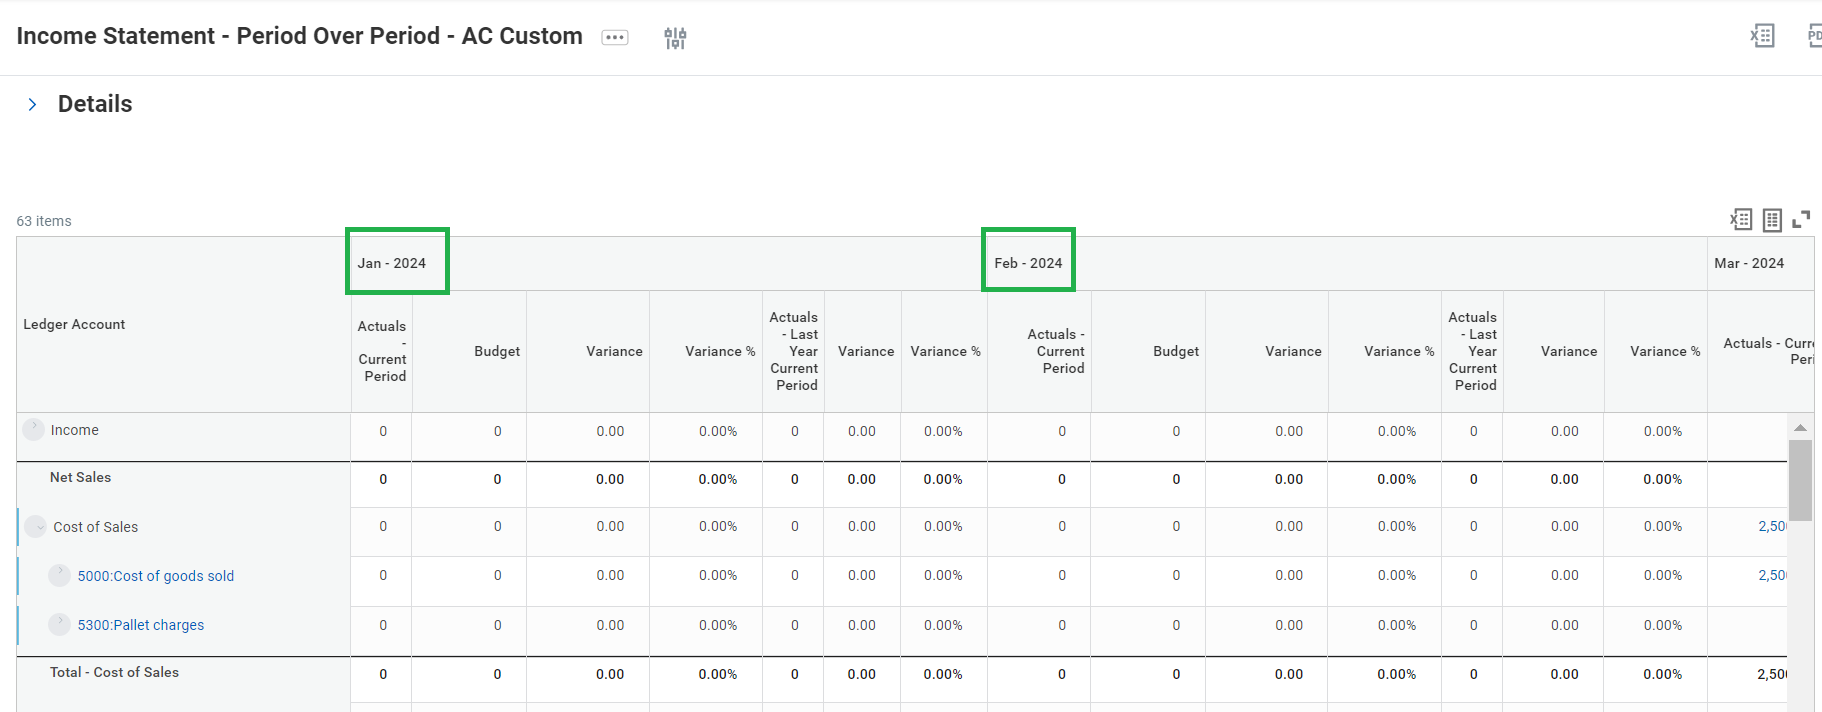
It can be tricky to get your organization’s financial reports into the format that works best for the people for running and maintaining them, especially while getting used to viewing them in “Workday” format after being accustomed to your previous system’s interface. With custom composite reports, Workday can help tailor the output to exactly what you need. Whether you’d like the data to repeat by your divisions, or different companies in a consolidation structure, Workday can make reporting easy and dynamic.
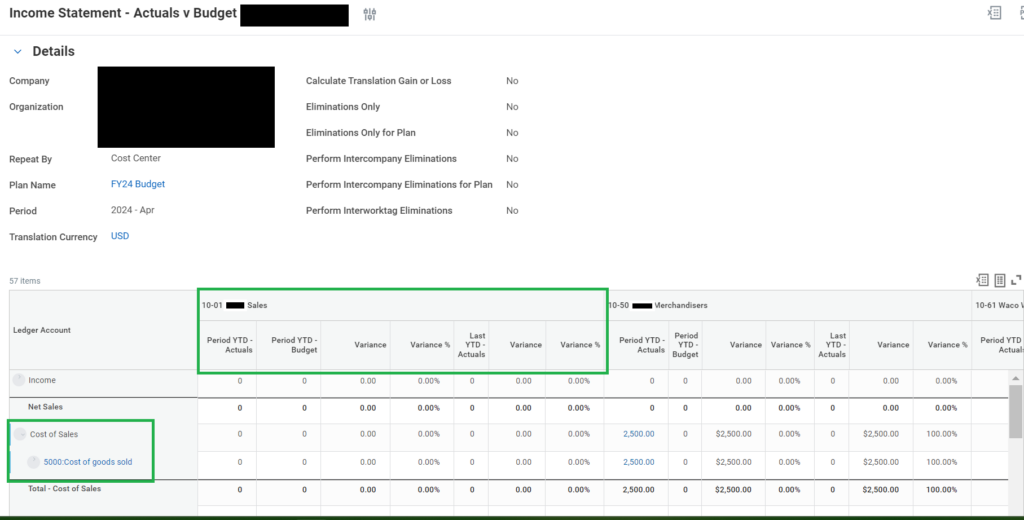
It’s helpful to have your reporting in multiple formats. For example, you could create an alternate view by periods, rather than organizations. This option can be added to a prompt set so one report can be used for multiple purposes, or additional custom reports could be scaled out to create stand alone versions to support these other specific use cases.
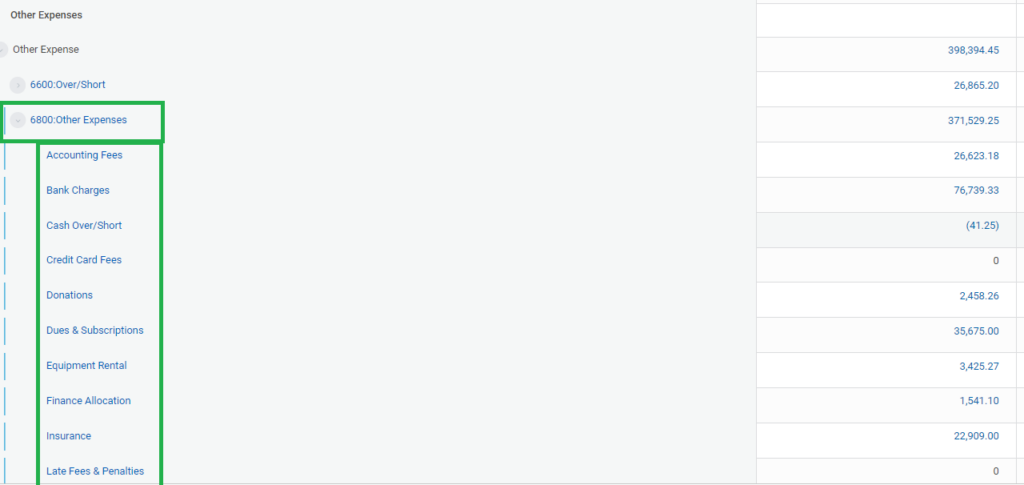
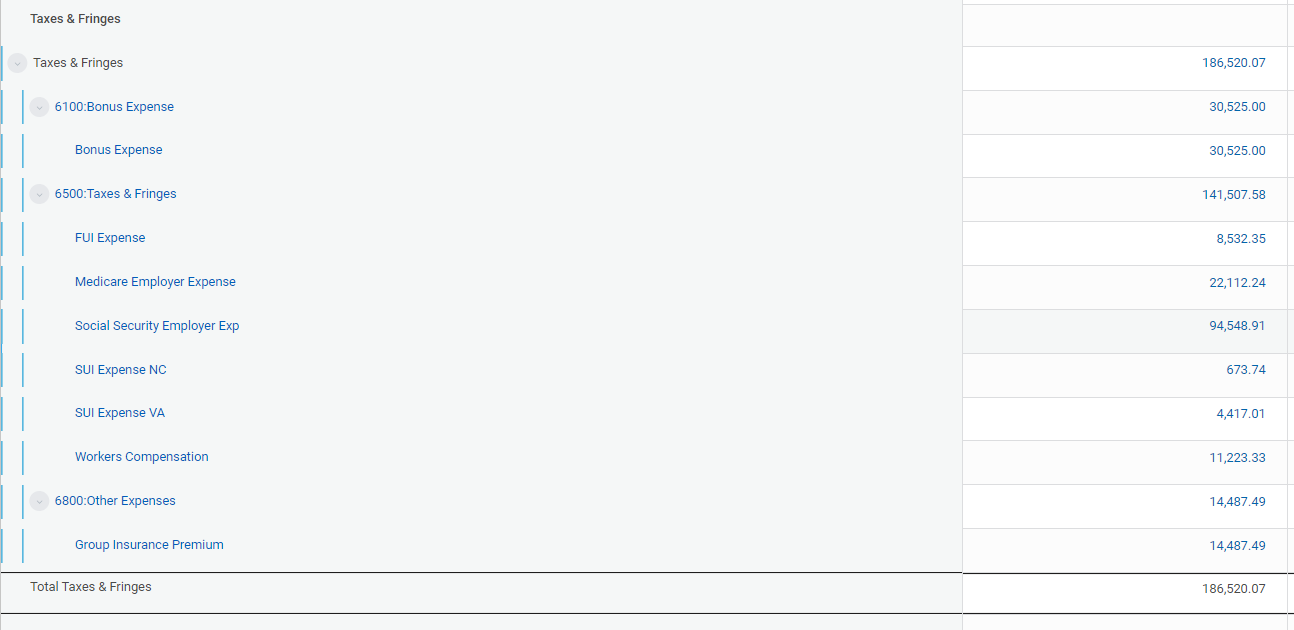
You can also include calculations into your reports to incorporate budget structures and variances, or outline structures to dive into the details of your account sets within the financial reports. Calculations can be fully customized to various time periods and outline structures can be set up to include spend categories, revenue categories, ledger account hierarchies, and other worktags or objects tied to your journal entries.
BIRT
Compensation Review Processes come with constant communication with your employees receiving awards. It’s helpful to create custom “BIRT” print outs tied to custom reporting to share this information. Below is a small snipet of a Compensation Review statement delivered to employee’s and their managers for review conversations that includes performance results, as well as compensation increases. These statements can be customized to add as much detail as you’d like to display, depending on what might be relevant to your review conversations.
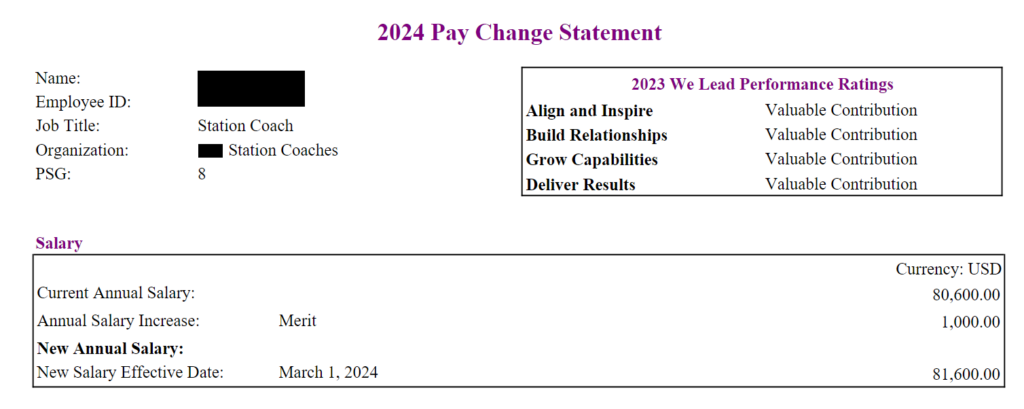
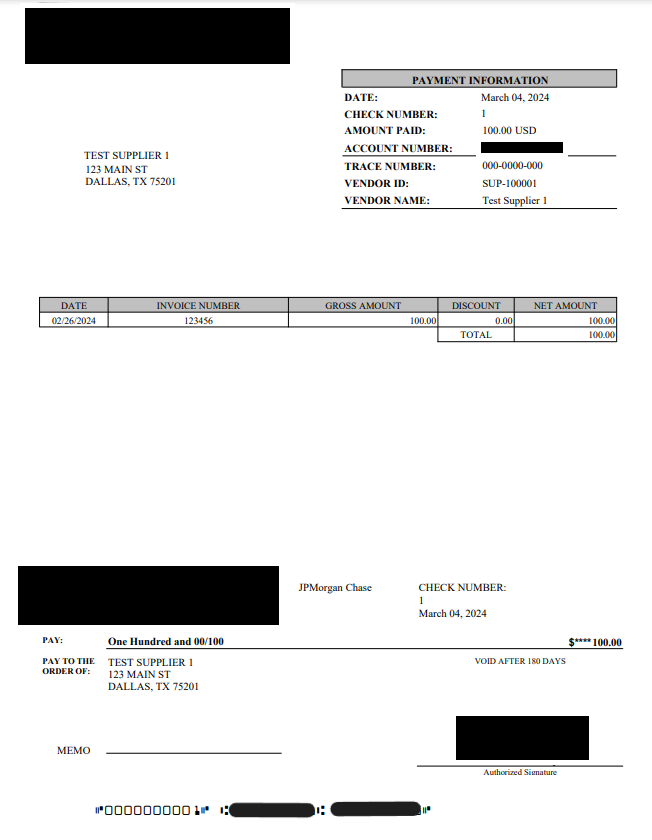
BIRT can also be leveraged to create custom layouts for pay checks, payslips, supplier invoices, customer invoices, talent cards, additional types of employee reviews, benefits letters, time cards, and more. Elements such as your organizations’ various logos, location or address information, and employee level details are all dynamic and can be delivered on these documents seamlessly through your business processes.
Worksheets & Discovery Boards
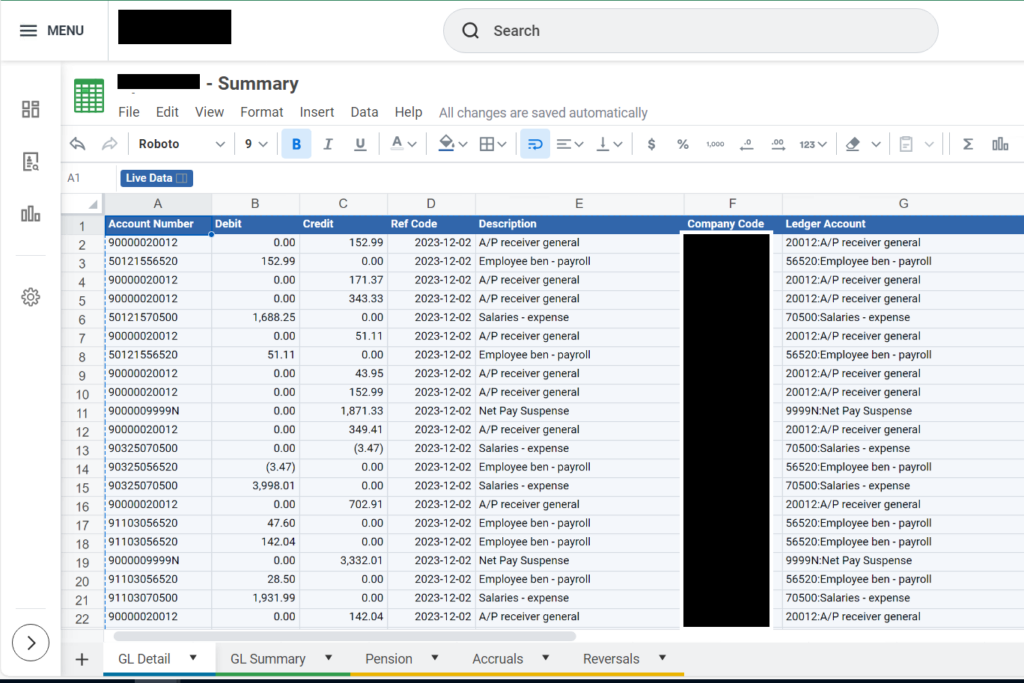
Workday Drive is an often unexplored tool in most customer’s tenants. However, the tools within, like Worksheets and Discovery Boards, are powerful for the both the most experienced users and budding report writers alike.
Worksheets, seen below, leverage live Workday data drawn from custom reports to offer up to date looks at the data at hand. Functioning much like an excel workbook, this tool is not only intuitive but very useful in adding pivot tables, conditional formatting, and other organization that a stand alone advanced, or matrix report (for example) cannot support.
Discovery boards are great visual tools to learn and explore the different data sources and object models within Workday. They can be used as stand alone visual “dashboards,” or copied into custom report definitions to be used outside of Workday Drive. Metrics and tabs can be tailored to your liking, depending on the use case, and shared securely based on tenant wide and user based security assignments.

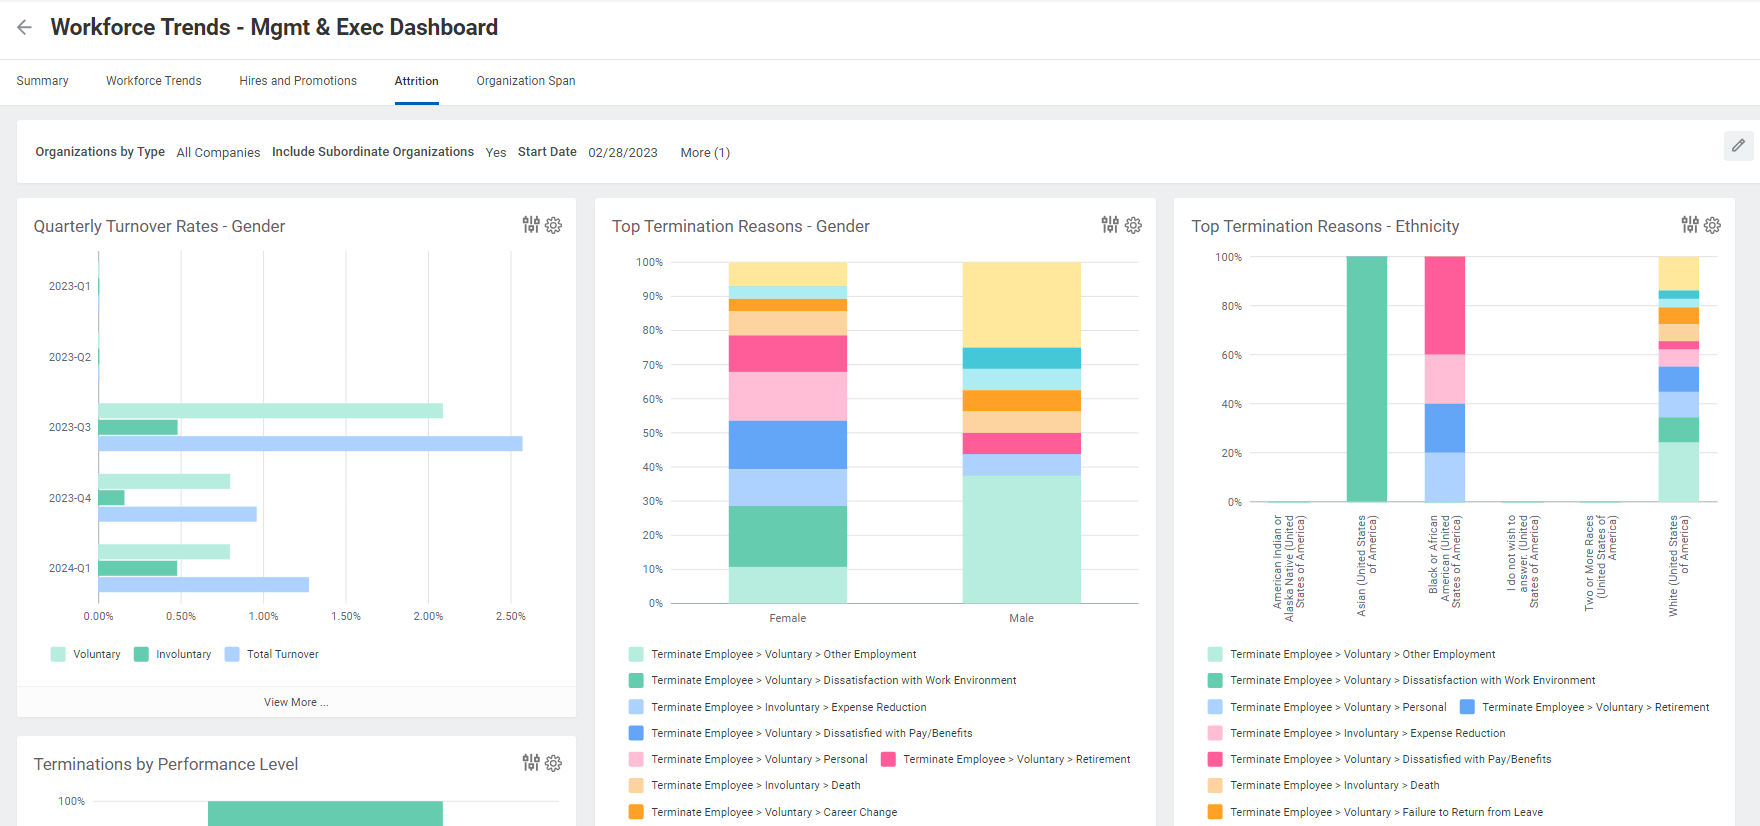
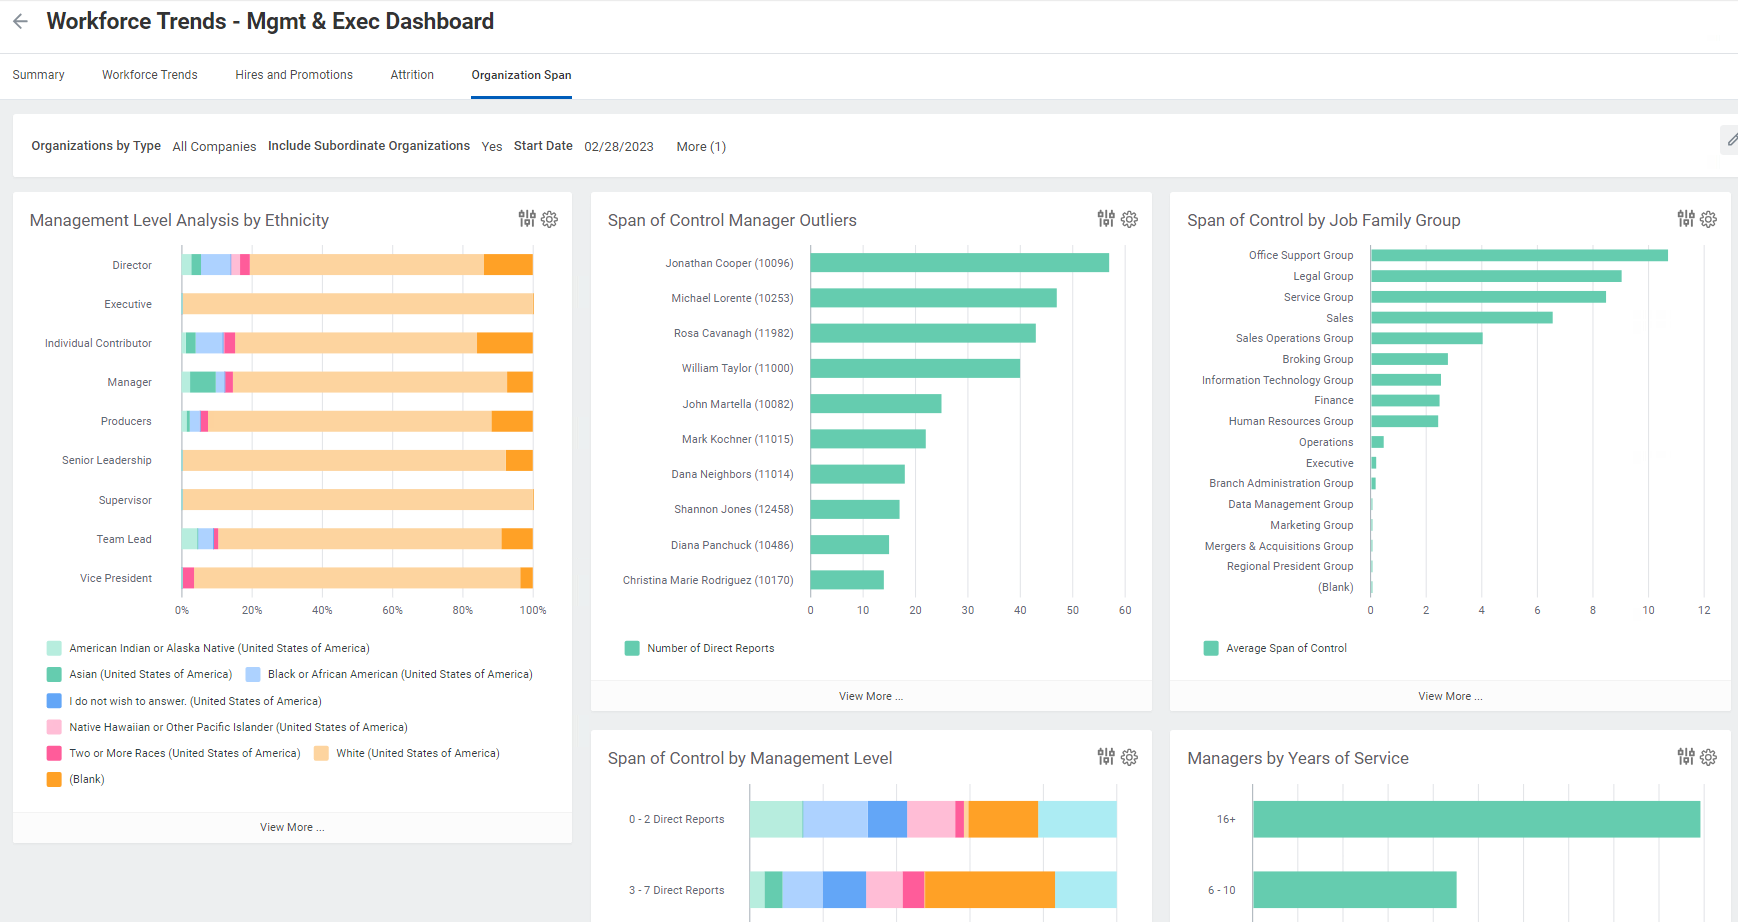
Workforce Dashboards
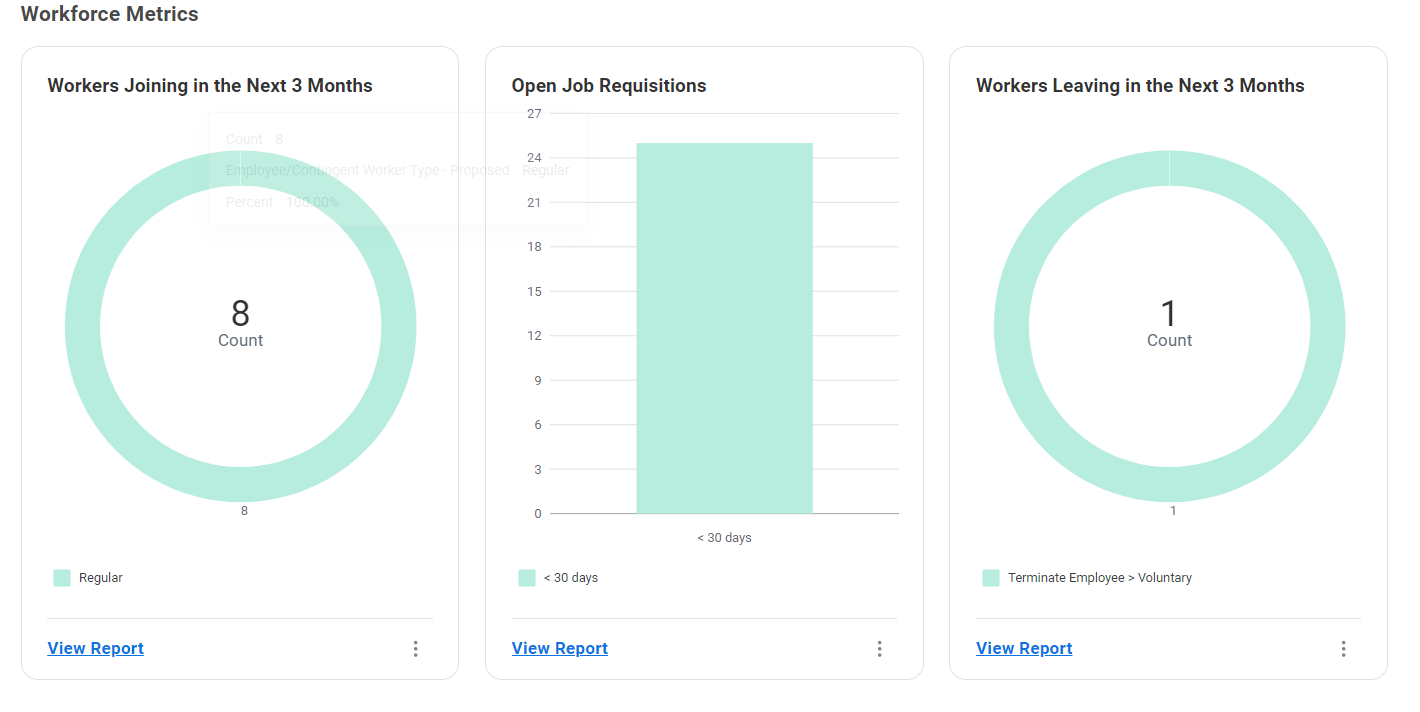
This workforce analytics dashboard helps customers break down factors contributing to employee movement and retention within their organization and make data-driven decisions around workforce planning. While it is a delivered solution from Workday that can be imported directly into customer tenants from Customer Central by implementers, it can also be tailored to fit your unique needs.
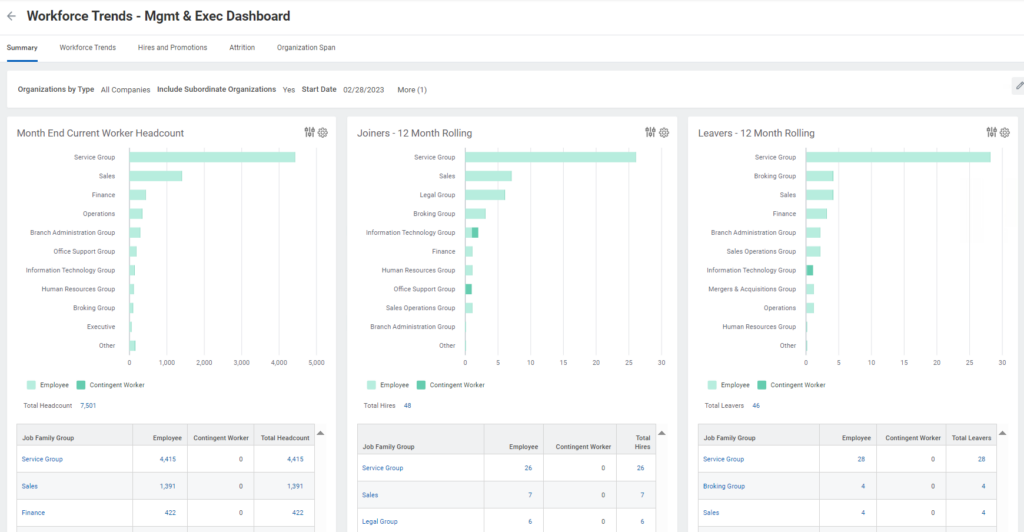
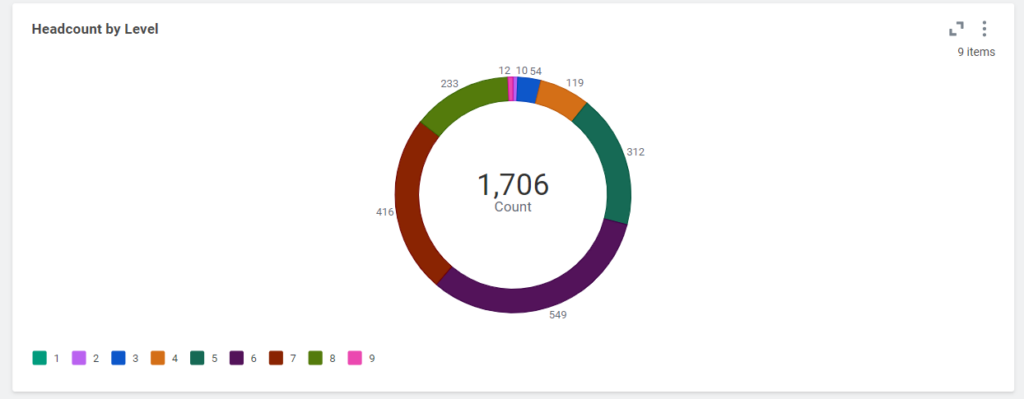
Track headcount, hiring, and termination trends all in one place and group by the metrics that are most meaningful to your organization.
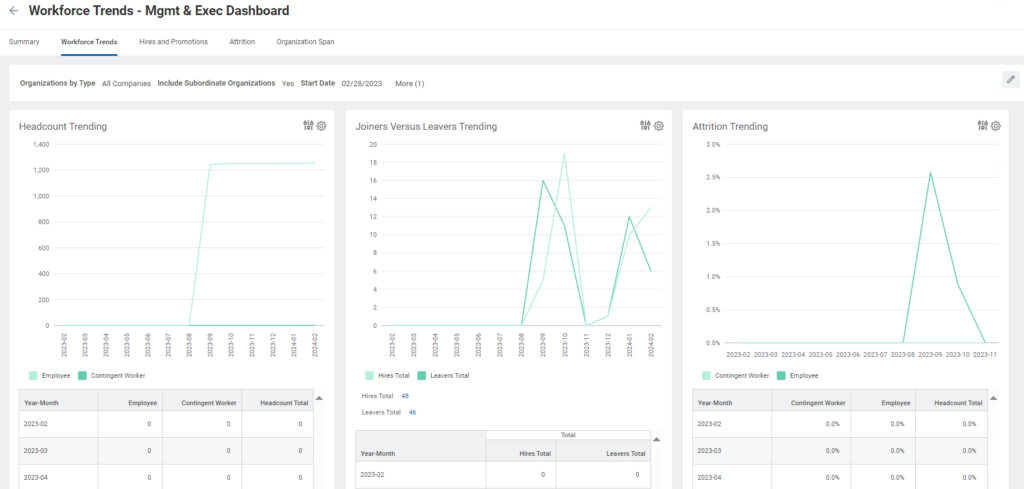
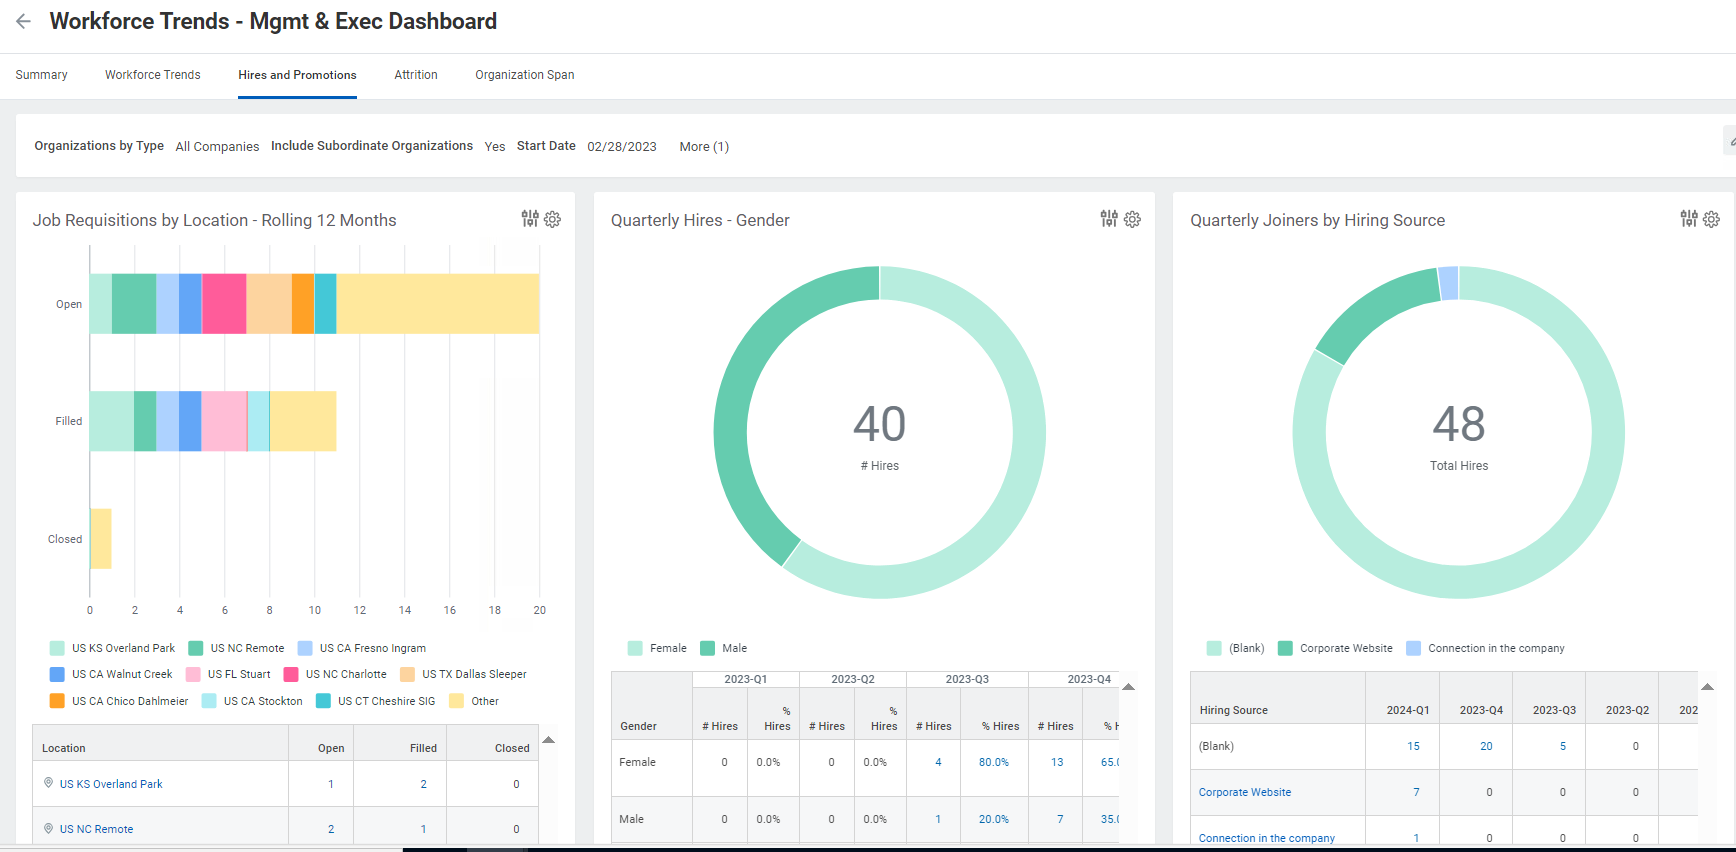
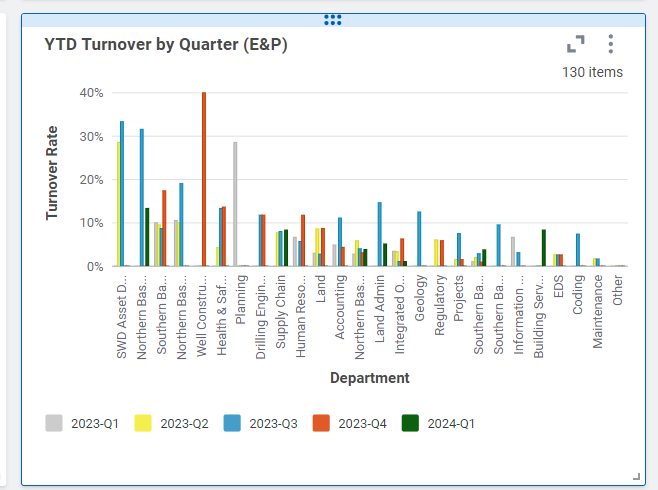
Turnover calculations are automatically tracked and can be run for various date ranges within the dashboard. You can also hone in on factors influencing retention, such as your organization’s span of control (meaning, how many direct or indirect reports is any one manager overseeing? Are they overburdened?) and other general hiring/attrition trends.
Social Reporting for ESG
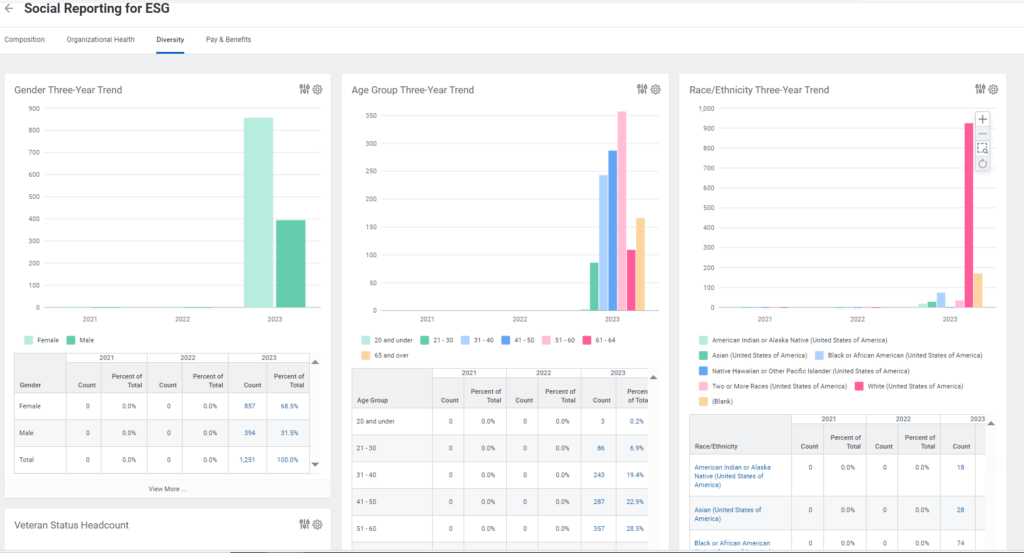
This social reporting dashboard suite empowers organizations to explore key dimensions of their employee population, its demographics and experience.
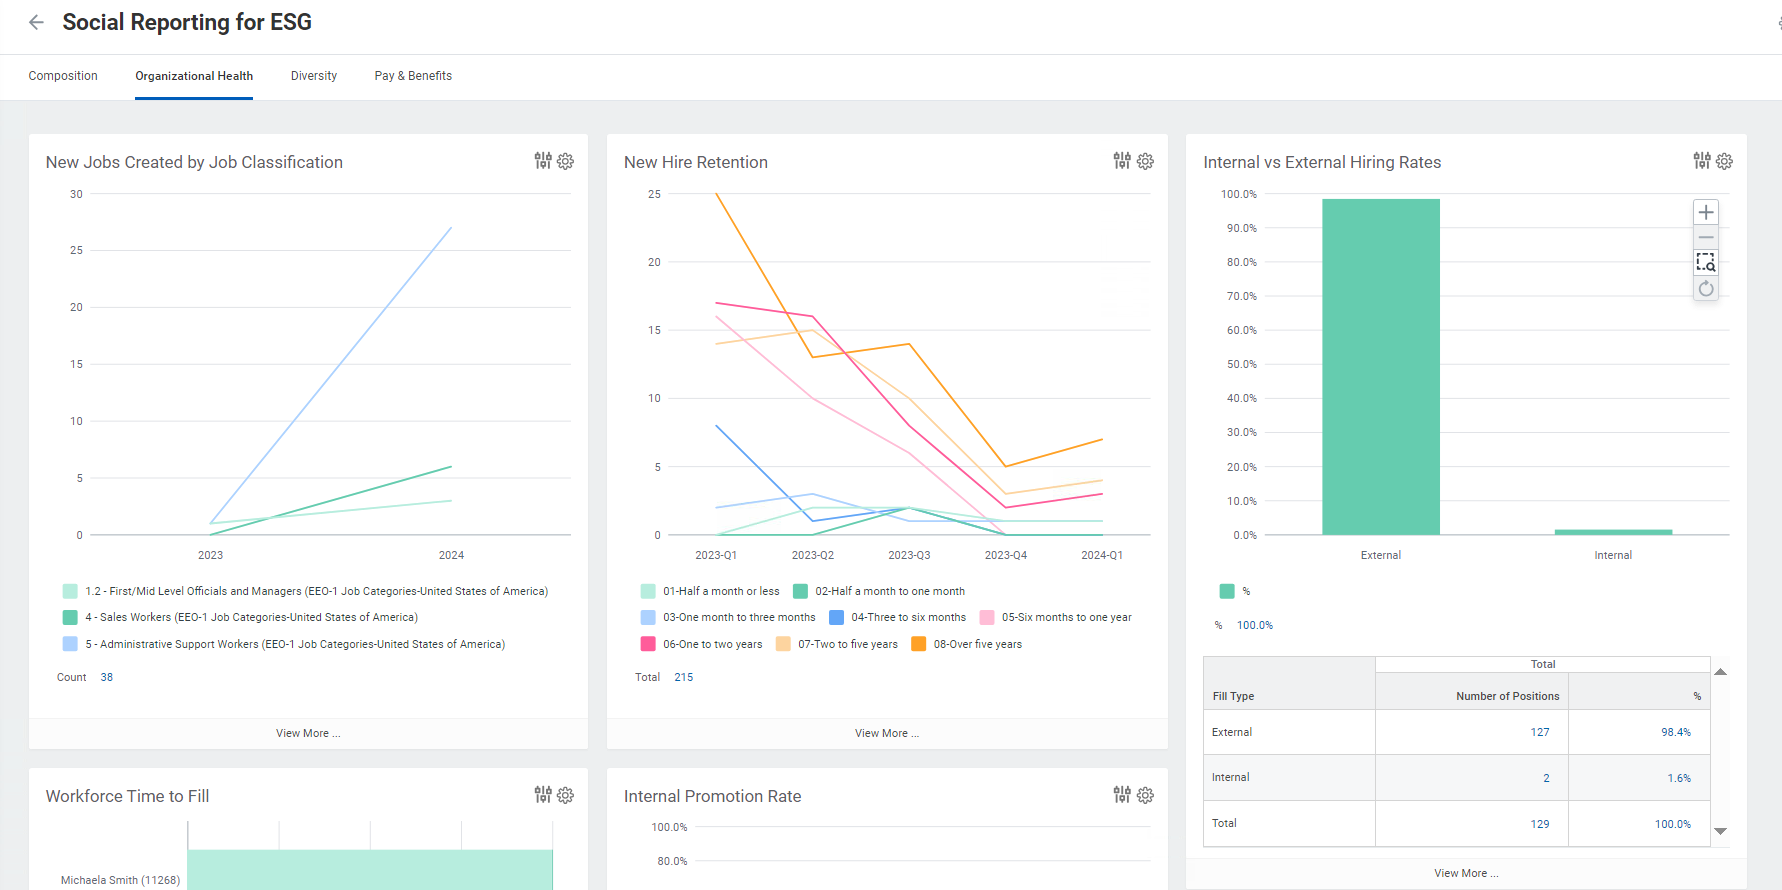
The Gender Distribution and Ethnicity Breakdown visualizations help HR and leadership teams monitor representation and support diversity, equity, and inclusion (DEI) initiatives. The Age Band Distribution enables insight into generational trends and succession planning, while the Tenure Buckets chart provides visibility into workforce experience levels—supporting strategies around retention, onboarding, and internal mobility.
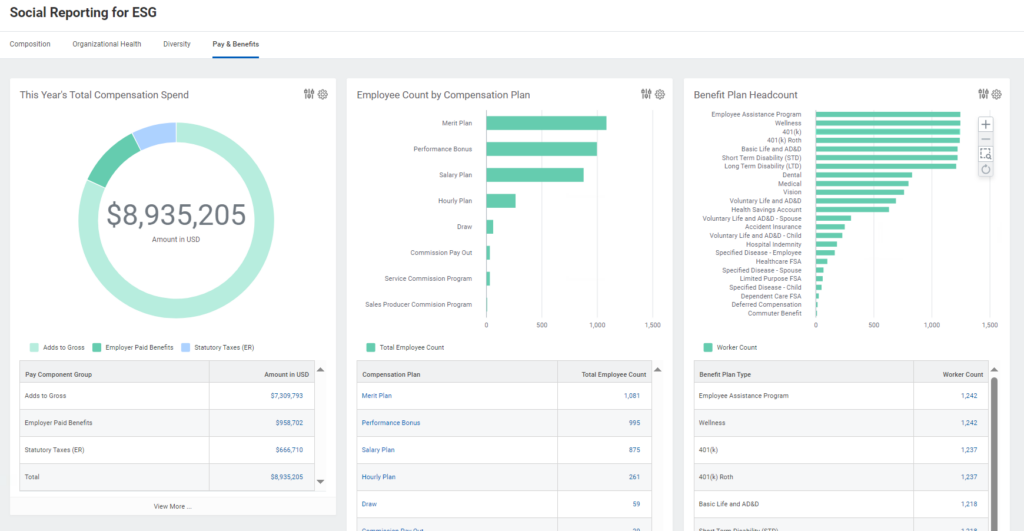
This dashboard can also be leveraged to track compensation and employee benefit costs to your organization. These can be customized or scaled, as needed.
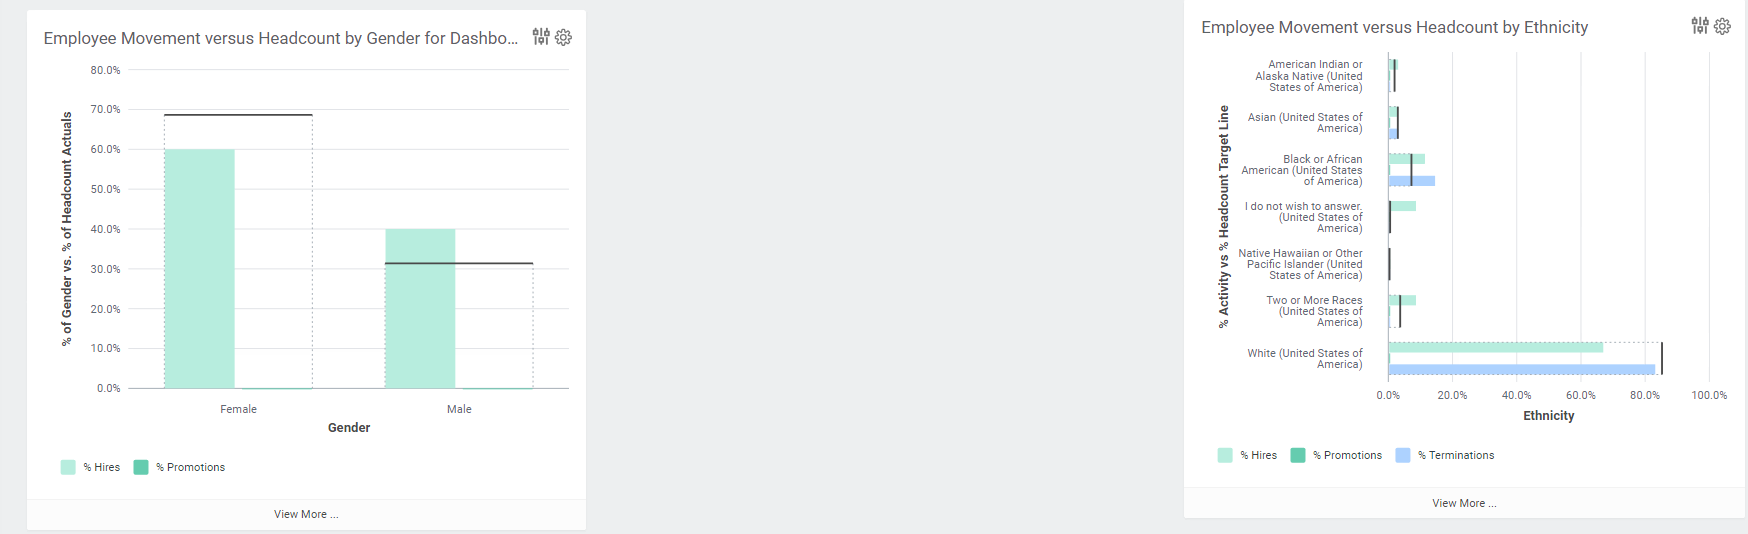
Finally – keep track of your headcount movement across groups for diversity purposes, or customize to create new visuals that display by different metrics such as supervisory organization, manager, a custom org or calculated field, or job profile, to name a few.
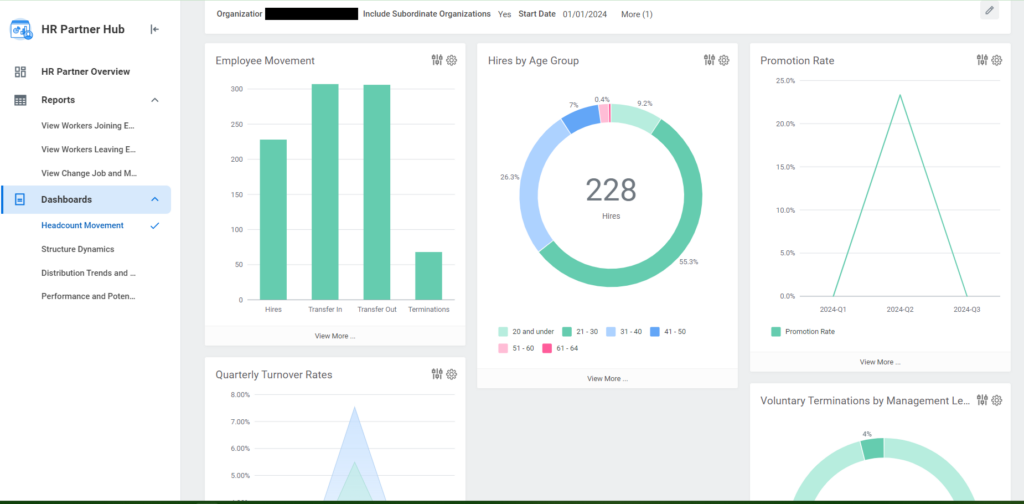
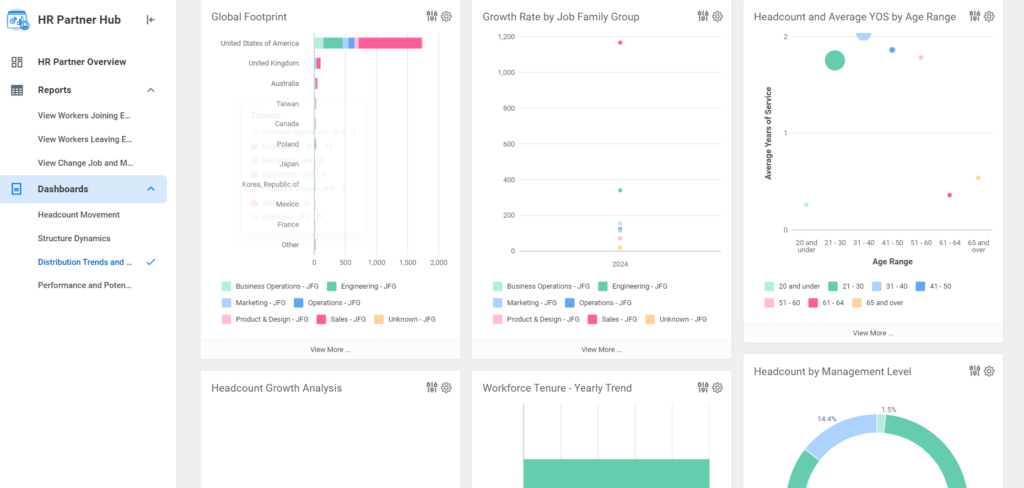
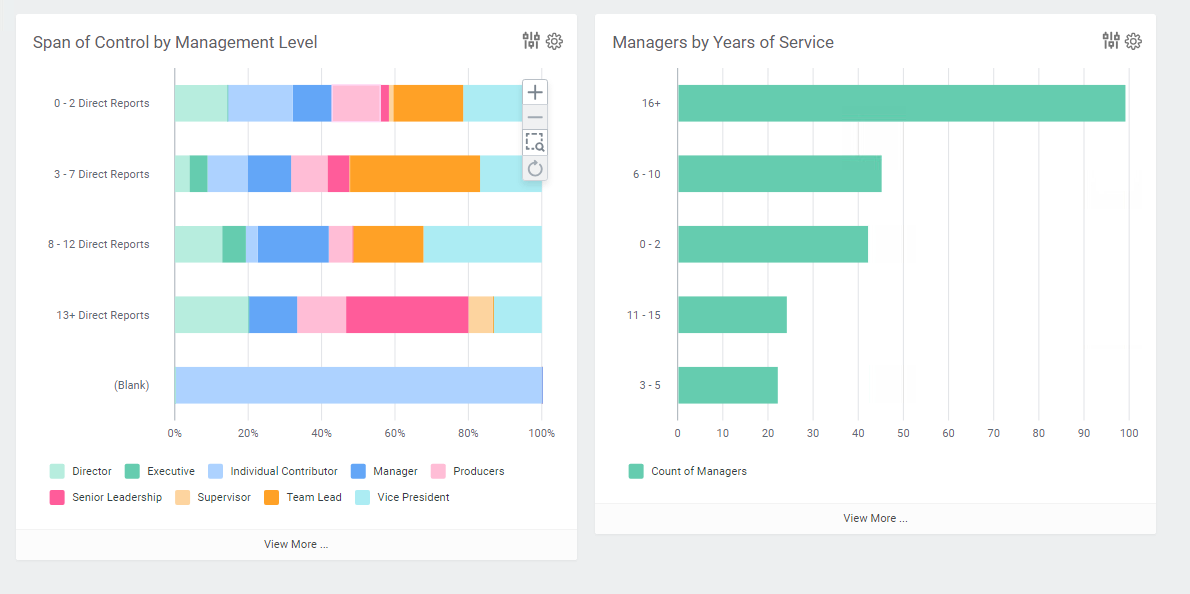
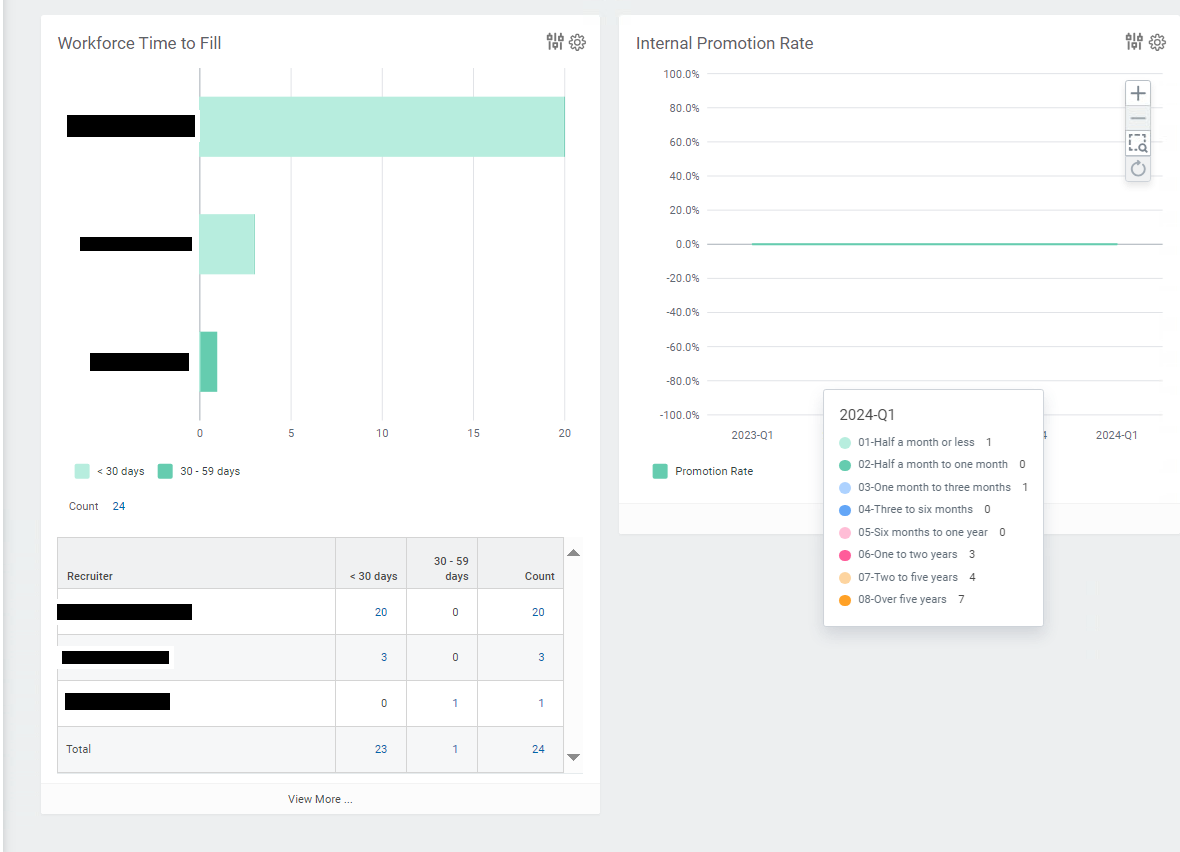
HR Partner Hub
Hubs are newer functionality from Workday that brings both delivered and custom reports and dashboards, as well as tasks, commonly used by a group (in this case, HR Partners) all together in one, comprehensive “Hub.” While Hubs do require a bit of enablement, they can be fully customized to include the metrics and tasks relevant to their audience. With dynamic security and prompting, your HR Partners can have everything they need to manage organizations they support and operate efficiently through their busy days.
Custom Visualizations
You can add visualizations to the majority of your Workday reports – namely, with matrix and composite reports, or through discovery boards. Customize to create presentable and most importantly, digestible metrics to present at your next executive meeting, or include in periodic memos to your team.


Let’s Connect
Email: joey.rowe.rcg@outlook.com